Sunday, November 15, 2015

LOL Graphs, Quantitative Energy, and Icy Hot

      This past week, we completed worksheets that covered quantitative energy problems and LOL graphs. These main ideas connect with each other because they all deal with energy being absorbed or lost. We also performed the Icy Hot lab, where we discovered what a heating curve looked like.

LOL Graphs We received two worksheets dealing with LOL graphs. We were given a situation such as "a cup of coffee cools as it sits on the table". Then we filled in the initial and final graph. Eth represents the temperature. 1 bar stands for 0°C, 2 bars stand for 25°C, 3 bars stand for 60°C, and 4 bars stand for 100°CEph represents the phase, i.e., solid, liquid, or gas. 1 bar signifies a solid, 2 bars signifies a liquid, and 4 bars signifies a gas. For this particular problem, the initial Eth is 4 bars, because it is stated that the cup of coffee is hot. The final Eth is 2 bars, because the cup of coffee should've cooled down to room temperature. The initial and final Eph are both 2 bars, because the  coffee always stayed a liquid. After we filled in the graphs, we drew how many "bars" of energy was gained or lost. In this problem, 2 bars of energy was lost.
cup of coffee problem
Quantitative Energy Two worksheets were given to us relating to quantitative energy. Using one of two formulas given to us, we solved each problem. The formulas were Q=m*c*ΔT and Q=m*Hv or m*Hf.  We were also given energy constants. It takes 334 J/g to melt or freeze. It takes 2260 J/g to evaporate or condense. The heat capacity of solid water is 2.1 J/g*°C. The heat capacity of liquid water is 4.18 J/g*°C. 
example of a quantitative energy problem
Icy Hot Lab In this lab we discovered what a heating curve looked like. We first attached a pressure sensor to the LabQuest interface. We then placed a temperature probe in a cup of ice and began stirring. When the temperature stopped dropping, we turned on the hot plate to high and immediately started Experiment on LoggerPro. A couple minutes after the water boiling, we turned the hot plate off. Afterwards, we printed out our heating curve. The results was a step formation.
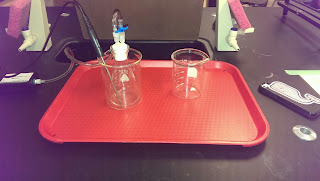
temperature probe stirring melted ice
our heating curve graph
      We came to know and understand the ideas this week by completing worksheets and labs. I still have a few questions about quantitative energy. My participation this week was good because I contributed to class discussion. I would rate my understanding of all the ideas this week an 8 because I'm still not sure about quantitative energy. I don't think I need to work on anything. My ideas have changed because I know more now than I did in the beginning of the week.

Tuesday, November 3, 2015

PTVn Problems and Experiments

      Over this past week, we solved PTVn problems and reviewed for the exam on Monday. These main ideas connect with each other because PTVn problems was on the exam. 

PTVn Problems We received two worksheets relating to PTVn. We had to find the missing pressure, temperature, volume, or number of particles by using a table. The table had us fill in the initial, final, and effect of the PTVn. Occasionally, we were given temperature in Celsius. To convert Celsius to Kelvin, we added 273 to Celsius. The standard temperature is 273 K and the standard pressure is 1 atm, 760 mmHg, or 4.5 psi. After we filled out the table and found the missing PTVn, we created particles diagrams based off of our table.
Example of a PTVn problem
Exam Review Fourth hour started a whiteboard with everything we learned in Unit 2. We, however, thought they lacked a few key ideas and added on to what they had. The first key idea was the popcorn particles. This experiment taught us how gas particles moved and spread. The second key idea was the food dye experiment. This experiment taught us how liquid particles moved in hot and cold water. The third key idea was the PTVn tables, graphs, and labs. The PTVn labs and graphs taught us how pressure, temperature, volume, and number of particles related with each other. The PTVn tables taught us how to find missing variables. The final key idea was the "blowing up student" experiment. This experiment taught us how more gas particles causes expansion.
Whiteboard of the key ideas
      We came to know and understand the ideas this week by completing worksheets and doing whiteboard activities. I do not have any other questions relating to what we did last week. My participation this week was good because I contributed to the class discussion. I would rate my understanding of all the ideas this week a 10 because I am positive I know and understand everything we went over. I don't think I need to work on anything. My ideas have changed because I now know more than I did in the beginning of the week.

Sunday, October 25, 2015

PTVn and graphs

      This past week, we blew up a student and performed PTVn experiments. These main ideas connect because the amount and speed of the particles continued changing through each stage of both the experiments. We also altered the original graphs we created through out experiments.

Blowing Up Luke Luke was placed on top of a black blowup bag. Four students stuck straws into the holes of the bag and blew air particles in. At first, the bag inflated and surrounded Luke. There were few air particles that moved slowly at this stage. As more air particles were blown in, the bag inflated all the way and slowly lifted Luke from the table. At this stage, there were many more air particles which moved faster than before, resulting in a fully inflated bag. Afterwards, we created a storyboard of the particles in the blowup bag in 4 different stages.
storyboard of Luke being blown up
Pressure Vs. Volume For this experiment, we found how pressure and volume correlated. The first step we took was to attach a pressure sensor to the LabQuest interface. Then we proceeded to set up the graph and table. We started with the syringe at 10mL and recorded the pressure. We then moved the syringe so the pressure got either larger or smaller but never exceeding 2.1 atm. We continued this until we got 5 points. Afterwards, we added a line of best fit, which to our surprise, was an inverse proportional graph. Our prediction was a directly proportional graph. We came to the conclusion that as the volume got larger, the pressure became lower.
pressure sensor for this experiment and the next one
Pressure Vs. Number of Particles For this experiment, we figured out how pressure and the number of particles related. The first step is to attach a pressure sensor to the LabQuest interface. Then we set up the graph and table. We then set the syringe at the 5 mL mark and recorded the pressure. Then we set the syringe to the 7 mL mark, pushed the syringe down to 5 mL and recorded the pressure. We continued this until we got 5 points. Afterwards, we added a line of best fit, which was a directly proportional graph. Our prediction was also a directly proportional graph. We came to the conclusion that the larger the amount of particles, the larger the pressure. Our graph did not show up on the desktop, although we finished this experiment. As a replacement, I borrowed table 6's graph. 

Pressure Vs. Temperature In the experiment, we found out how pressure and temperature related. The first thing we did was attach the temperature and pressure sensors to the LabQuest interface. We then set up the graph and table. Then we had to securely put the stopper in the flask. However, we forgot to complete this step so our data was incorrect. We then placed the flask in a 600 mL beaker. Then we found the pressure and temperature of room temperature. Then we recorded the pressure and temperature of hot water, warm water, ice water, and alcohol/ice bath. Afterwards, we added a line of best fit, which was a directly proportional graph. Our prediction was also a directly proportional graph. We concluded that the higher the temperature, the larger the pressure. Since we messed up on our experiment, I used table 1's graph as a replacement.
temperature and pressure sensors for this experiment
Alcohol/ice bath - Lauren
Graphing After we created the graphs for the PTVn, we were told to "mess around" with the graphs and alter how the looked. For the pressure vs. volume graphs, I changed the x-axis to 200 mL and the y-axis to 2.0 atm.
altered graph for pressure vs. volume
For the pressure vs. puffs graph, I changed the x-axis to 30 puffs and the y-axis to 5.0 atm. Again, I originally used table 6's graph.
altered graph for pressure vs. puffs
For the pressure vs. temperature, I changed the x-axis from °C to K. I also changed the x-axis to 500 K and the y-axis to 2.0 atm. Again, I originally used table 1's graph.
altered graph for pressure vs. temperature 
      We came to know and understand the ideas this week by completing experiments, creating storyboards, and having class discussions. I do not have any other questions relating to what we did this past week. My participation this week was pretty good, in my opinion. I would rate my understanding of all the ideas this week a 9 because I'm sure I know everything, I just have some doubts. I don't have anything I need to work on.

Saturday, October 17, 2015

chem blog - popcorn and particles

      This past week, we learned about particles in gas and liquids through a popcorn scent and food coloring. These main ideas connect with each other because gas and liquid particles both move, which we learned through experiments and discussions in class.

Popcorn Particles A bag of popcorn was brought into the room. We were told to raise our hand when we smelled the popcorn. The people closest to the popcorn bag smelled it instantly. The people farther back took a longer time to locate the smell. As the popcorn particles dispersed throughout the room, the scent became fainter than originally. We then created a storyboard of what we thought happened with the popcorn particles. The green dots represent popcorn particles and the purple dots represent air particles.
Storyboard of the popcorn particles traveling
Food Coloring We were given two beakers filled with cold and hot water. We then placed a drop of food coloring in each beaker. In the cold water beaker, the food coloring stayed mostly in one spot. In the hot water beaker, the food coloring dispersed almost immediately. Therefor, we theorised that the cold water had slower moving particles and the hot water had faster moving ones. After the experiment, we created another storyboard of what we thought happened with the food coloring and hot and cold water.
Storyboard of the food coloring experiment.
Food coloring experiment

      We came to know and understand the ideas this week by completing experiments, creating storyboards, and discussing the ideas during class. I do not have any other questions relating to what we did this past week. My participation this week was mediocre because I got distracted often by my group members. I would rate my understanding of all the ideas this week a 10 because I'm sure I know and understand everything. I need to work on focusing more during class.


Sunday, October 11, 2015

chem blog - mass, volume, and density

      Over this past week, we finished the rest of worksheet #3 and put the answers up on whiteboards, completed worksheet #4 as a class, found the density of a gas through an experiment, and found the thicknesses of two different aluminium foil. These main ideas connect because for each worksheet/experiment, we had to use the concept of mass, volume, and density being related.

Worksheet #3 We completed the rest of this worksheet, which is problems 4 to 8, through whiteboards with our table. Problem 4 showed a graph and a pan balance of substance A and substance B. We first had to find out what would happen if equal masses of A and B were put into the pans. We then had to find out what would happen if equal volumes of A and B were put into the pans. Afterward, we found the slope for A and B and explained the physical meaning of slope for each substance. Then we found the mass and volume of A and B when the other substance was a specific value. We then sketched water's density (1.00 g/mL) on the graph. Finally, we determined wether substance A or B would sink or float when placed in a bucket of water.
Our answers for 4 a-b
Our answers for 4 c-f
Problem 5 gives us an empty graph and a table with substances and their density. We were asked to sketch a graph of mass vs. volume for titanium, copper, and mercury. Problem 6 states that a certain cube measure 2.00 cm on every side. We first had to find the volume of the cube in both cm3 and mL. Then we found the mass of the lead, nickel. and zinc cube using the table given in problem 5.
Our answers to 5 and 6
Problem 7 states that Alicia's boyfriend gave her a supposedly 24 carat gold. Alicia found the mass, final volume, and initial volume of the ring. We were asked to find the volume and density of the ring and wether or not Alicia should dump her boyfriend. Problem 8 gives us the meniscus measurement and the measurement of the water level after a solid object was dropped into the graduated cylinder. It also gives us the density of the object. We had to determine the mass of the object.
Our answers for 7 and 8
Worksheet #4 This worksheet focused on applied density problems. We were given the density and either mass or volume of a substance. We then had to calculate either the mass or volume of the substance, depending on what was given. Most of the worksheet was done as a class.

Density of Gas We were given a submerged bottle in a water-filled basin. A tubing end was stuck under the bottle. We then measured about 40 mL of water and poured it into the plastic squeeze bottle. Then we massed the plastic squeeze bottle and cup with Alka-Seltzer. Then we dropped the cup with Alka-Seltzer into the bottle and screwed on the cap with tubing. Afterwards we shook the bottle for about 10 minutes and waited for all the gas to go through the tube. We then marked the water line with pencil and took the submerged bottle out of the water. The volume of the gas was found as we discussed in class. Then we massed the contents of the bottle after the reaction. For my data, the mass before the reaction was 67.848 grams. The mass after was 67.814 grams. The mass of the gas was 0.334 grams. The volume of the gas was 184 mL. We found out that the density of the gas was 0.00181 g/mL. After everyone completed the experiment, we compared our data as a class.
Submerged bottle in water-filled basin
shaking the bottle with Alka-Seltzer in it
Gas going through the tube into the submerged bottle
Measuring the volume of the gas
Class data for this experiment
Aluminium Foil We were given two supposedly equal sheets of two different brands of aluminium and the density of aluminium (2.7 g/cm3). We first found the mass of both sheets. Then we found the volumes by dividing density from mass. We then measured the length and width of the sheets. Afterwards, we calculated the thickness of the sheets by dividing the volume by the multiplicative of the length and width values. Our mass and volume for the first sheet was 2.343 grams and 0.8678 cm3. Our mass and volume for the second sheet was 3.082 grams and 1.141 cm3. The thickness for the first sheet was 0.0016 cm. The thickness for the second sheet was 0.0024 cm.
Whiteboard of our results
      We came to know and understand the ideas this week by comparing answers and data as a class and discussing what occurred. I don't have any questions relating to what we learned this week. My participation this week was pretty good but I got distracted a couple times. I would rate my understanding of all the ideas from this class a 10 because I'm sure I know and understand all the concepts that we covered this past week. I need to work on not being distracted by my friends as often.

Saturday, October 3, 2015

chem blog - plotting data and worksheets

      This past week, we looked into the relationship between cm^3 and mL and graphed it on graphing paper. We also found the mass and volume of 5 bits of steel, aluminium, and acrylic and graphed that on LoggerPro. These main ideas connect with each other because both the cm^3 & mL and mass & volume create graphs that appear linear. Another thing we did was begin working on a worksheet titled mass, volume, and density.

Cm^3 and mL We filled a plastic box of water with 5 different amounts of water and calculated the volume in cm^3 and mL. We found the cm^3 volume by finding the measurements of the width, height, and length of the water in the box and multiplying them together. We found the mL volume by pouring the boxed water into a graduated cylinder and read the measurements. Afterwards, we graphed our data, with mL as the dependent variable and cm^3 as the independent variable. The graph appeared to be traveling in a linear fashion with a ratio of 1 to 1.

plastic box

pouring the boxed water into a graduated cylinder
reading the measurement of the graduated cylinder

graph for cm^3 vs. mL
Mass and Volume We took 5 pieces of steel, aluminium, and acrylic and found their mass and volume. We found the mass by placing pieces on scales. We found the volume by filling a graduated cylinder with water and reading that measurement, then dropping a piece into the graduated cylinder and reading that measurement, and then finding the difference between the two values. Then we recorded the mass and volume into our composition notebooks. Soon after, we graphed our results on LoggerPro. We plotted the data and created a line of best fit. I had difficulty with my graph because I couldn't figure out how to make the points appear. We then compared the slopes of the line of best fit as a class. For steel, the slopes hovered around 7.026 to 8.319. For aluminum, the slopes were about 1.253 to 2.610. For acrylic, the slopes were from 0.6197 to 1.495. One group messed up on aluminum and acrylic's slope.
reading the measurement before putting in the acrylic
putting in the acrylic
reading the measurement after putting in the acrylic


Worksheet We received a worksheet that focused on mass, volume, and density. We completed problem 1, 2, and 3 on the whiteboards and compared them as a class. Problem 1 and 2 pictured two prisms named A and B. We had to compare their mass, density, and volume. For problem 3, there were two prisms named E and F and we had to explain which one we thought was more dense. Half the class thought that E's density was the same as F's. The other half thought that E's density was larger than F's. I think that E's density was larger than F's because E's particles are larger, resulting in larger density.
Our answers for questions 1 and 2

      We came to know and understand the ideas this week by talking about what data we got with the class and graphing on graphing paper and LoggerPro. I don't have any other questions relating to what we did this week. I think my participation this week was good because I communicated with my table group and took part in the experiments. I would rate my understanding of all the ideas this week a 9.9 because I'm sure I know and understand everything that we covered. I don't think I need to work on anything.

Sunday, September 27, 2015

chem blog - white boards and zeros

      During this past week, we compared our data for our experiments from the previous week, made histograms based off the data, and created particle white boards of what happened. These main ideas connect because the data allowed us to make a histogram and both the histogram and white boards allowed us to understand what we were learning. Since we made a histogram and white board for station #1 last week, this week we made the histograms and white boards for stations #2-6. We also looked into significant and placement zeros. 

Station #2 data, histogram, white board (dhw) For this station, we massed a pulled apart steel wool and a burned steel wool. The overall class data was varied. It ranged from 0.48 grams to 0.9 grams. My group had a 0.488 grams change in mass. The reason why these results are so varied is because everyone had different amounts of steel wool when they were massed. For the white board, my group drew the pulled apart steel wool particles, before and after it was burned. The before particles were black dots, evenly spaced. In the after picture, the particles of the steel wool was black and blue, due to a chemical reaction that happened. We also showed how bits of the blue particle fell off the steel wool.
white board of the steel wool burning
class data (left)
histogram (right)
Station #3 dhw At this station, we massed an ice cube before and after it melted. The class data was similar to each other, except for two outliers. It ranged from -0.1 grams to 0.9 grams. The outliers were 0.9 grams and 0.68 grams, My group had a -0.1 gram change in mass. The reason for the outliers might be that they forgot to add the cap onto the scale after the ice had melted. For the whiteboard, my group drew the ice particles, before and after it was melted. For the ice particles, we drew blue dots representing water and red dots representing air particles all mixed together. For the melted ice particles, we drew the blue dots on the inside and red dots on the outside. 

whiteboard of ice melting
class data (left)
histogram (right)
Station #4 dhw At this station, we massed CaCl2 and Na2CO3 before and after they were mixed together. The class data was almost the same, except for one outlier. My group had a -11 change in mass, which was also the outlier.  The reason for this outlier is that when we were massing the mixture, we forgot to add the empty vial onto the scale. On the whiteboard, we drew particle pictures of CaCl2 and Na2CO3 before and after they were combined. On the before section, in the first vial, we drew green circles representing calcium chloride and blue circles representing water, all mixed together. In the second vial, we drew purple circles representing sodium carbonate and blue circles, all mixed together. On the after section, the first vial had purple, green, and blue dots all mixed together. The purple and green dots had triple lines connecting them, showing that those particles might have bonded. 

whiteboard of the mixture
class data (left)
histogram (right)
Station #5 dhw  For this station, we massed a sugar cube and a vial of water, before and after the sugar cube dissolved. The class data ranged from -0.4 grams to 0.9 grams. The outlier was 0.9 grams. My group had no change in mass. The reason for the outlier may be that they didn't mass the cap of vial before the sugar had dissolved. For the whiteboard, my group drew the sugar cube and water particles, before and after the sugar had dissolved. In the before picture, the purple dots represent the sugar particles and the blue particles represent the water particles. In the after picture, the vial contains blue and purple dots.
whiteboard of the dissolving sugar
class data (left)
histogram (right)
Station #6 dhw For this station, we massed the Alka-Seltzer and vial of water before and after the Alka-Seltzer dissolved. The overall class data was very close to each other. The data ranged from -0.103 grams to -0.05 grams. My group had a -0.05 grams change in mass. I think that the reason for the dissolved Alka-Seltzer to lose mass is because gas bubbles escaped the vial. On the whiteboard, we drew Alka-Seltzer particles represented by black circles and water particles represented by blue circles. After the Alka-Seltzer had dissolved, we drew blue and black circles mixed together and black dots floating upward to represent the gas bubbles. 
whiteboard of the dissolving Alka-Seltzer
class data (left)
histogram (right)
Zeroes We received a packet that had problems about significant and placeholder zeros. Significant zeros are zeros that are between significant digits (non zero). Placeholder zeros are zeros that tell you what place the number should be at. In the packet, there was a page that told us specific rules for significant and placeholder zeros. As my group was working on this, we found that some numbers could be true for more than one rule, which greatly confused us.
      We came to know and understand the ideas this week by working and talking together as a class to break down the material and data that was given. Questions I still have is about significant and placeholder zeros. I often can't tell which is which. I think my participation this week was very good because I discussed all the topics our class landed on with my group. If I had to rate my understanding of all the ideas from class, I would rate myself a 9 because I understand most but not all of the concepts that we learned. I feel like I don't need to work at anything specific at this moment.


Sunday, September 20, 2015

chem blog - mass and change

      Over the past week, we learned about changes in mass and the exploding paint can. These main ideas connect with each other because the exploding paint can was a change of mass. Most of the changes of mass were caused by chemical reactions but some of the changes of mass stayed the same. We performed six experiments to see the change in mass and one experiment as a class for the exploding paint can.

Exploding Paint Can We filled a small and a big paint can with methane, which is a gas lighter than air itself, and lit it on fire. In the beginning, the flame was blue at the bottom and fading to red and yellow near the top. As the fire started to die, the flame became more of a blue little bulb. When the fire finally died, the paint cans both made a loud bang that startled most of us. For the small paint can, it jumped off the table and fell onto the floor. However, for the big paint can, it only tilted, the reason might be that the can wasn't sealed tightly enough.

Station 1 We first massed a pie tin and used it to mass a piece of steel wool. Then we pulled apart the steel wool and massed it again. We thought that the mass would stay the same, mainly because no particles were lost or gained. As it turned out, the pulled apart steel wool was lighter than the original by 0.2 grams, most likely because when we were pulling it apart, bits of the steel wool didn't land in the pie tin, therefore attributing to the lighter mass.
whiteboard of the particles of the steel wool and pulled apart steel wool

Station 2 We first massed the pulled apart steel wool in a pie tin. We then picked up the pulled apart steel wool with a pair of tongs and placed the burner in the pie tin. Then we lit the burner and passed the steel wool in and out of the flame. As the steel wool was burning, flakes of it fell off and it turned a dark blue color. Before we burned steel wool, it had a mass of 5.612 grams. After we had burned the steel wool, it had a mass of 6.1 grams. I thought that the steel wool would get lighter, but in contrast, it grew heavier by 0.488 grams, due to the chemical reaction that happened.

steel wool before being burned
steel wool after being burned
steel wool being burned
Station 3 We first found the mass of the vial and ice. We then warmed the vial in our hands to speed up the melting. After the ice was melted, we massed the water and vial. The mass of the vial and ice was 10.6 grams. The mass of the water and vial was 10.5 grams. The ice and the water should've been the same mass because no chemical changes were made. The human error that may have occurred is that we forgot to zero our scales.

Station 4 There was vials of blue-colored CaCl2 and clear Na2CO3. We first massed CaCl2 and Na2CO3 together. We then combined the two solutions together and massed the mixture. The mixture turned out a cloudy blue. The mass of the two solutions was 53 grams. The mass of the mixture was 41.3 grams. The result was the mixture being heavier than the separate vials by 11.7 grams, which was caused by a chemical reaction from the two solutions. 
blue-colored CaCl2 and clear Na2CO3
The cloudy blue mixture

Station 5 We first filled a vial with water and put a sugar cube in the cap. We then massed the vial with the water and cap with sugar. Then we gently shook the vial and watched the sugar dissolve. Finally, we massed the dissolved sugar solution. The mass of the sugar vial before it was dissolved was 45.23 grams. The mass of the dissolved sugar vial was 45.23 grams. The sugar vial before it was dissolved turned out to be the same mass as the dissolved sugar vial because no chemical change was added.

Station 6 We first filled a vial halfway with water and a fourth tablet of alka-seltzer in the cap of the vial. We then put the cap and vial on the balance to mass it out. Then we put the alka-seltzer in the water, watched it dissolve, and then massed it. The mass of the vial and cap before the alka-selzter 34.96 grams. The mass of the dissolved alka-seltzer in the vial and cap was 33.88.  The change in mass was -1.08 grams. I was taken aback by this result because I thought it would increase in mass because two separate materials were combined. It may have decreased because of the bubbles making it lighter. 
dissolved alka-selzter in vial
      We came to know and understand the ideas we learned this week by performing experiments and making charts and histograms based off out data. Another thing we did was share our ideas on whit boards and had discussions about that topic.


our data for station 1 (left)
our histograms for station 1 (right)
      Questions I still have is why the burned steel wool had more mass than the original. I participated okay this week because there were some moments where I got distracted. If I had to rate my understanding of all the ideas from this class, I would rate myself an 8.5 because I understand most of the concepts, I just have a few questions. I need to work on staying more focused and organised.