Sunday, October 25, 2015

PTVn and graphs

      This past week, we blew up a student and performed PTVn experiments. These main ideas connect because the amount and speed of the particles continued changing through each stage of both the experiments. We also altered the original graphs we created through out experiments.

Blowing Up Luke Luke was placed on top of a black blowup bag. Four students stuck straws into the holes of the bag and blew air particles in. At first, the bag inflated and surrounded Luke. There were few air particles that moved slowly at this stage. As more air particles were blown in, the bag inflated all the way and slowly lifted Luke from the table. At this stage, there were many more air particles which moved faster than before, resulting in a fully inflated bag. Afterwards, we created a storyboard of the particles in the blowup bag in 4 different stages.
storyboard of Luke being blown up
Pressure Vs. Volume For this experiment, we found how pressure and volume correlated. The first step we took was to attach a pressure sensor to the LabQuest interface. Then we proceeded to set up the graph and table. We started with the syringe at 10mL and recorded the pressure. We then moved the syringe so the pressure got either larger or smaller but never exceeding 2.1 atm. We continued this until we got 5 points. Afterwards, we added a line of best fit, which to our surprise, was an inverse proportional graph. Our prediction was a directly proportional graph. We came to the conclusion that as the volume got larger, the pressure became lower.
pressure sensor for this experiment and the next one
Pressure Vs. Number of Particles For this experiment, we figured out how pressure and the number of particles related. The first step is to attach a pressure sensor to the LabQuest interface. Then we set up the graph and table. We then set the syringe at the 5 mL mark and recorded the pressure. Then we set the syringe to the 7 mL mark, pushed the syringe down to 5 mL and recorded the pressure. We continued this until we got 5 points. Afterwards, we added a line of best fit, which was a directly proportional graph. Our prediction was also a directly proportional graph. We came to the conclusion that the larger the amount of particles, the larger the pressure. Our graph did not show up on the desktop, although we finished this experiment. As a replacement, I borrowed table 6's graph. 

Pressure Vs. Temperature In the experiment, we found out how pressure and temperature related. The first thing we did was attach the temperature and pressure sensors to the LabQuest interface. We then set up the graph and table. Then we had to securely put the stopper in the flask. However, we forgot to complete this step so our data was incorrect. We then placed the flask in a 600 mL beaker. Then we found the pressure and temperature of room temperature. Then we recorded the pressure and temperature of hot water, warm water, ice water, and alcohol/ice bath. Afterwards, we added a line of best fit, which was a directly proportional graph. Our prediction was also a directly proportional graph. We concluded that the higher the temperature, the larger the pressure. Since we messed up on our experiment, I used table 1's graph as a replacement.
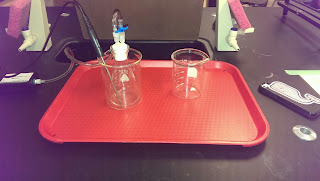
temperature and pressure sensors for this experiment
Alcohol/ice bath - Lauren
Graphing After we created the graphs for the PTVn, we were told to "mess around" with the graphs and alter how the looked. For the pressure vs. volume graphs, I changed the x-axis to 200 mL and the y-axis to 2.0 atm.
altered graph for pressure vs. volume
For the pressure vs. puffs graph, I changed the x-axis to 30 puffs and the y-axis to 5.0 atm. Again, I originally used table 6's graph.
altered graph for pressure vs. puffs
For the pressure vs. temperature, I changed the x-axis from °C to K. I also changed the x-axis to 500 K and the y-axis to 2.0 atm. Again, I originally used table 1's graph.
altered graph for pressure vs. temperature 
      We came to know and understand the ideas this week by completing experiments, creating storyboards, and having class discussions. I do not have any other questions relating to what we did this past week. My participation this week was pretty good, in my opinion. I would rate my understanding of all the ideas this week a 9 because I'm sure I know everything, I just have some doubts. I don't have anything I need to work on.

No comments:

Post a Comment